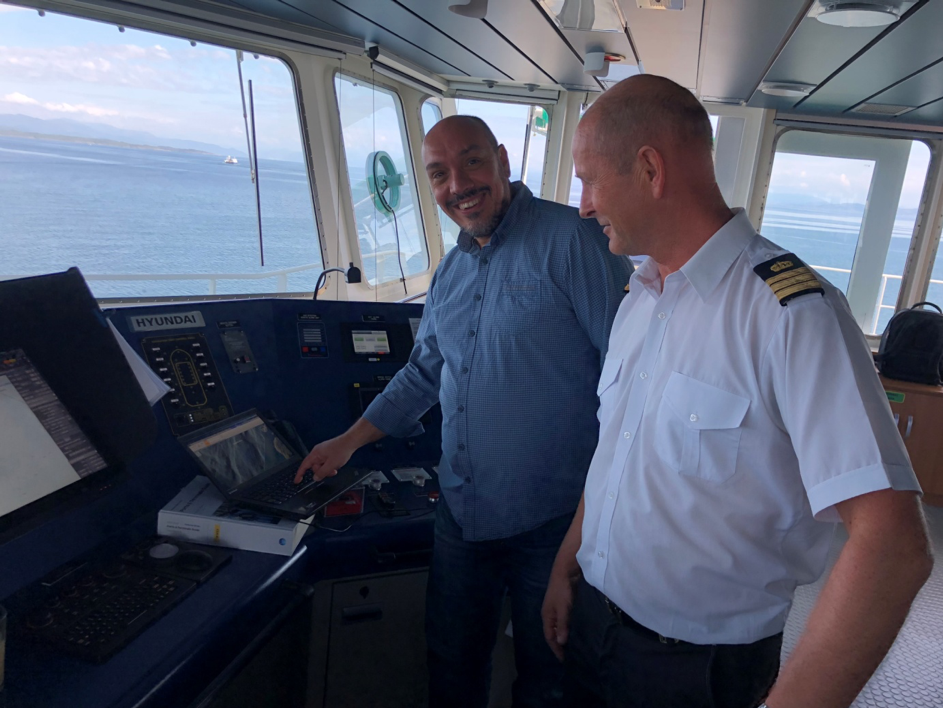
Captain of LPG “Kithnos” together with Modstein Hansen (marine pilot).
About Pilot Services*
The Norwegian Coastal Administration is responsible for the state pilot service.
- On board the vessels the pilot acts as an advisor and provides the crew with the necessary knowledge of the fairways to and from Norwegian ports.
- Pilot operations are carried out by the regional sea traffic offices under the management of pilot masters.
- The Norwegian Coastal Administration has just under 290 active pilots, stationed at 18 pilot stations.
*this information & more could be found at The Norwegian Coastal Administration website : https://www.kystverket.no/en/
Test Mission
The mission was to validate and test how and if S-102 data and the S-102 Demonstrator could give value in anchorage operations.
Test execution
- Date of test: 05/09/2018
- Responsible tester: Modstein Hansen (Marine pilot)
- S-102 Demonstrator Version: v5.5
- Weather Conditions: 5m/s north-westerly winds with clear weather and calm sea conditions
Dataset used
NORROGAL04
Layers/Charts
ENC cell NO5E0811.000
Chart system
ECDIS system, this was primarily used when manoeuvring into position.
The testing was done onboard several vessels:
- Anchorage on the Falkeid raft out of Kårstø gas terminal with LPG tanker “Kithnos” – the feedback detailed on this page is mainly related to the test onboard this vessel
- Oil tanker “Ardmore Enterprise” – pilotage service from anchor position in the “Herviksfjord” area, reviewing current anchorage sites together with the captain
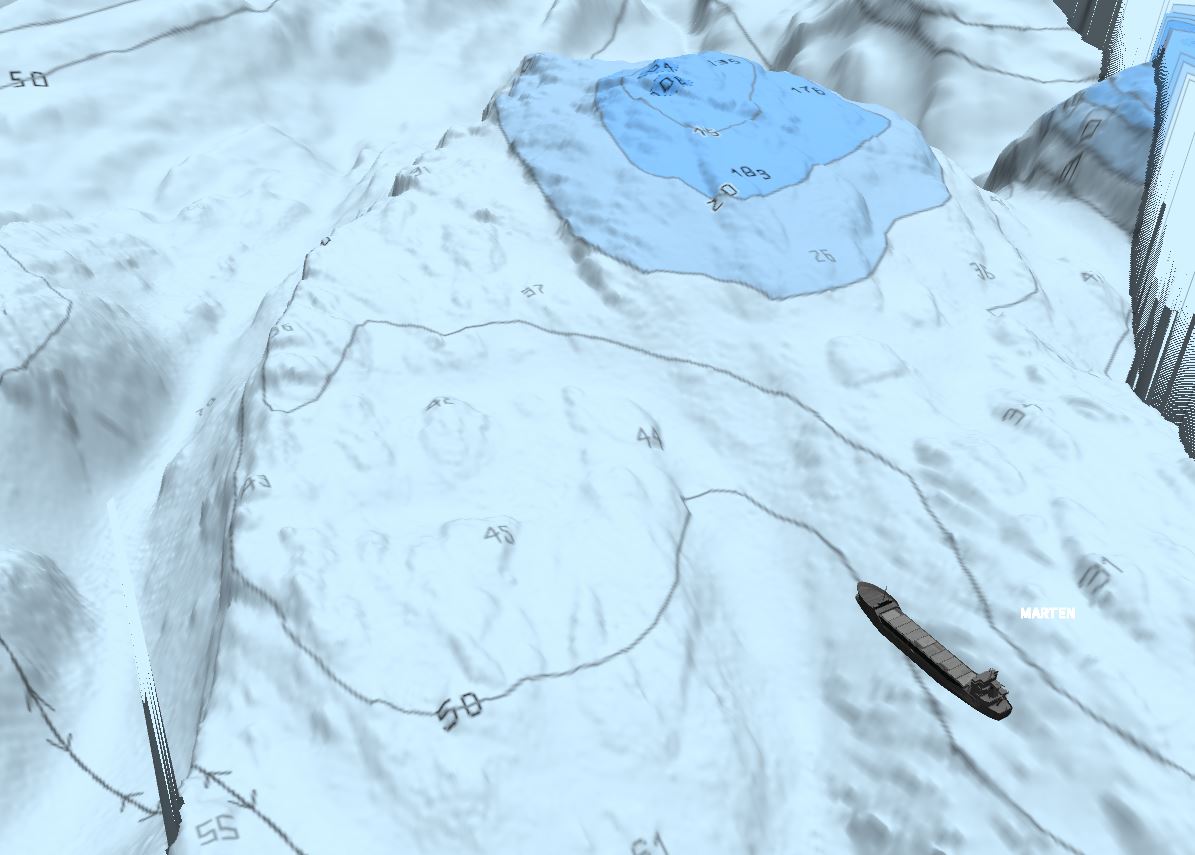
- Anchorage on the Falkeid raft out of Kårstø gas terminal with Cargo Vessel “Marten”
LPG “Kithnos”

Manoeuvring into anchor position, using EBL referenced from the ship’s bow. The blue vector indicates the ship’s course and speed. 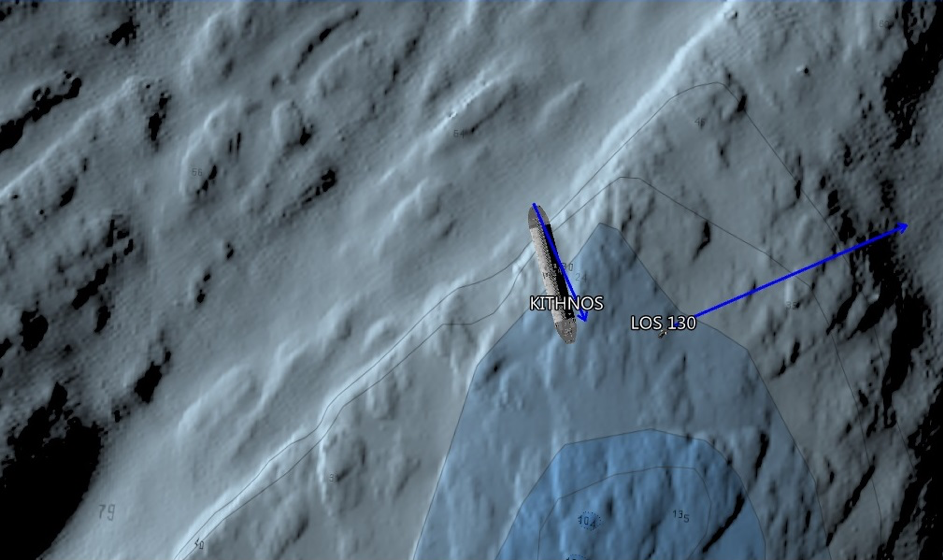
Drop Position. Slowly retracts to extend the anchor chain. 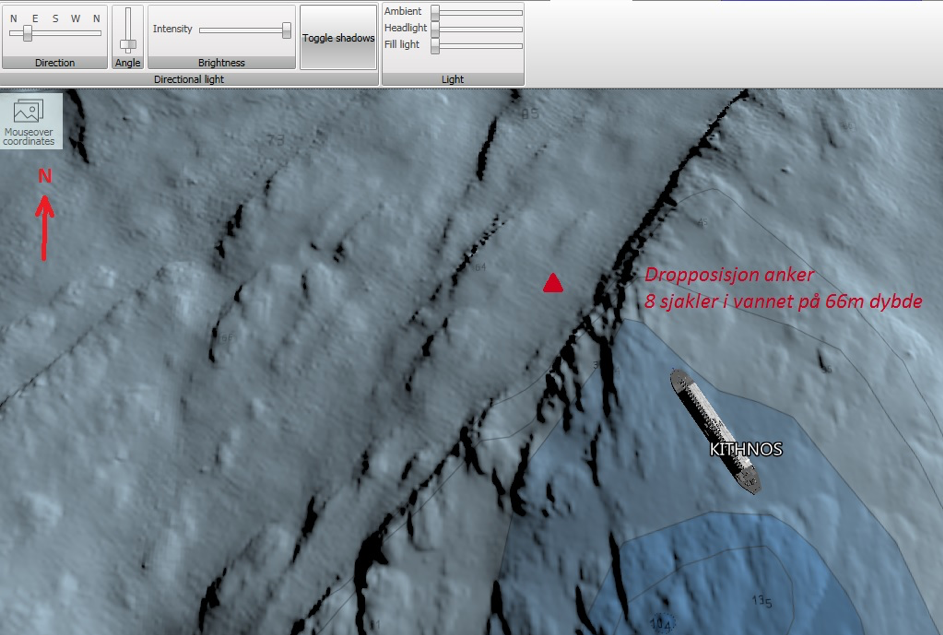
LPG “Kithnos” anchored at 66m depth, and with 8 shackles in the water.
“Ardmore Enterprise”
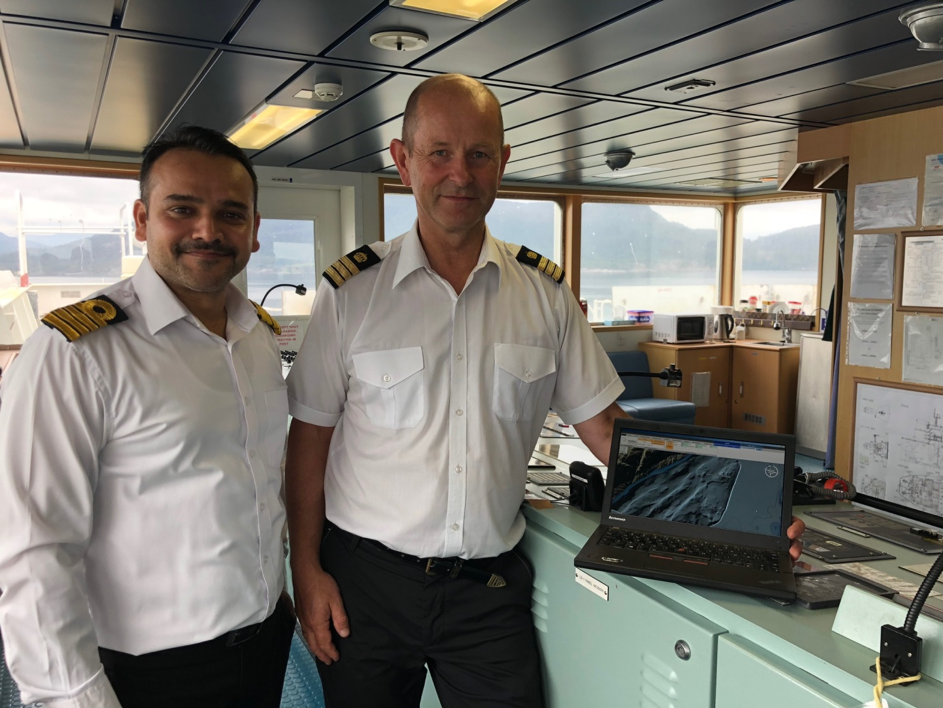
Captain and marine pilot onboard “Ardmore Enterprise” 
Anchored on soft sediments at 82m depth northwest of a shallow of 44m 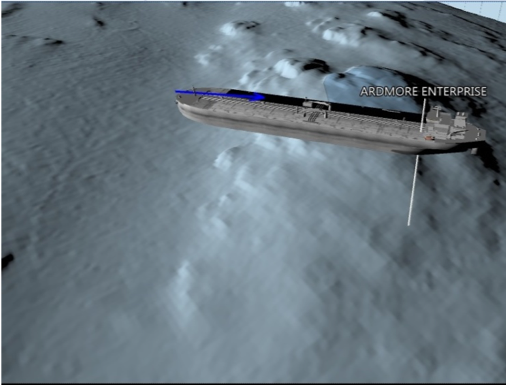
Oil tanker “Ardmore Enterprise” in anchor position
Cargo vessel “Marten”
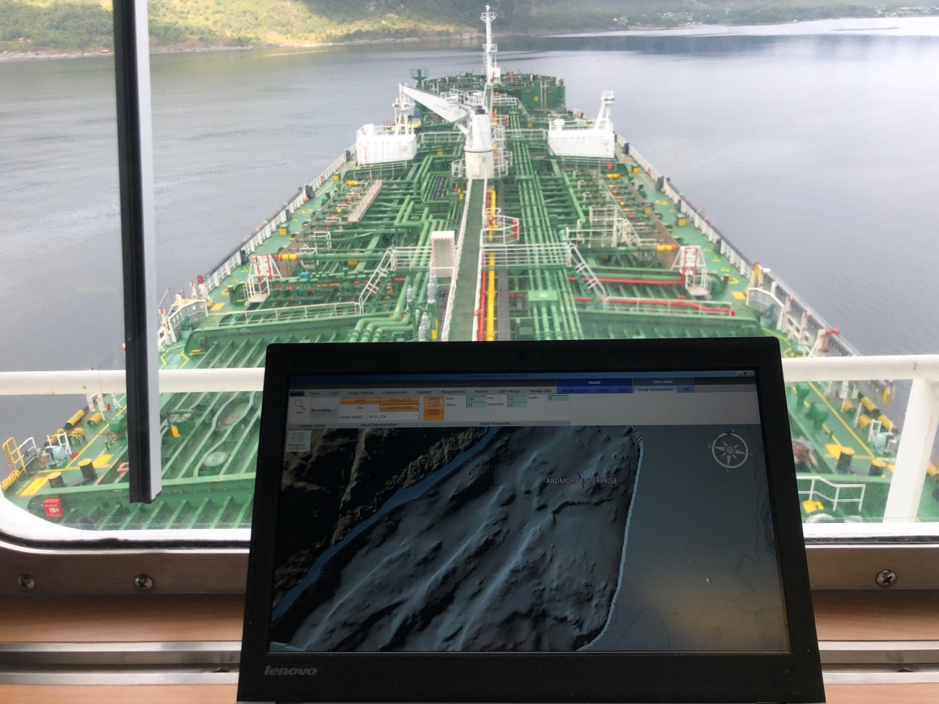
Sceenshot of mission by VTS Kvitsøy 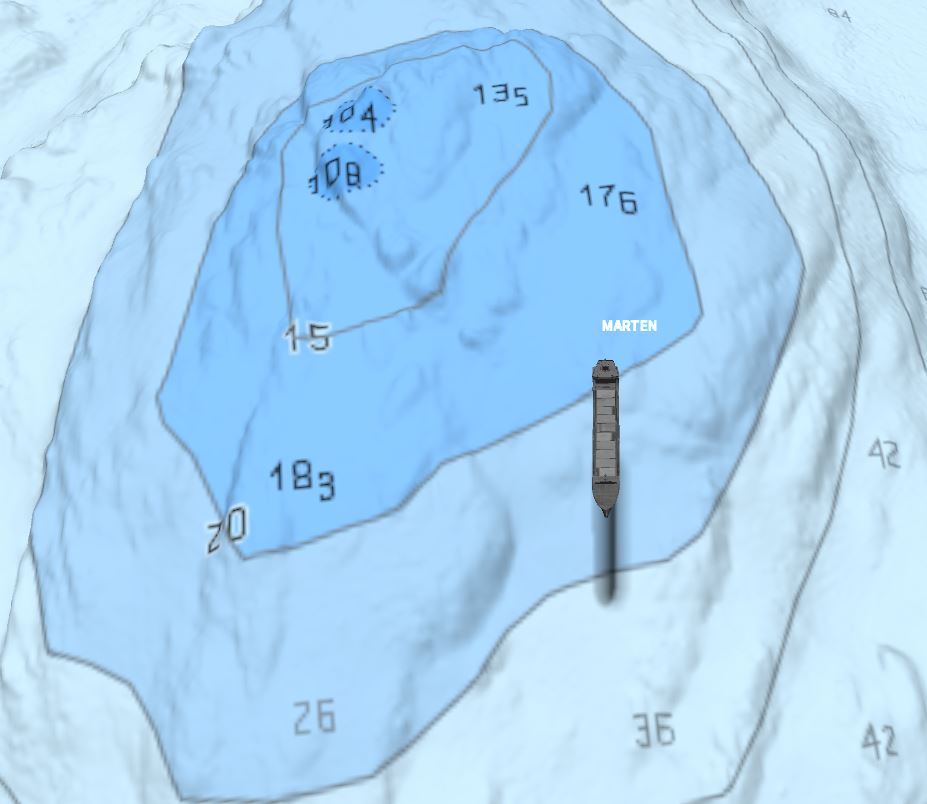
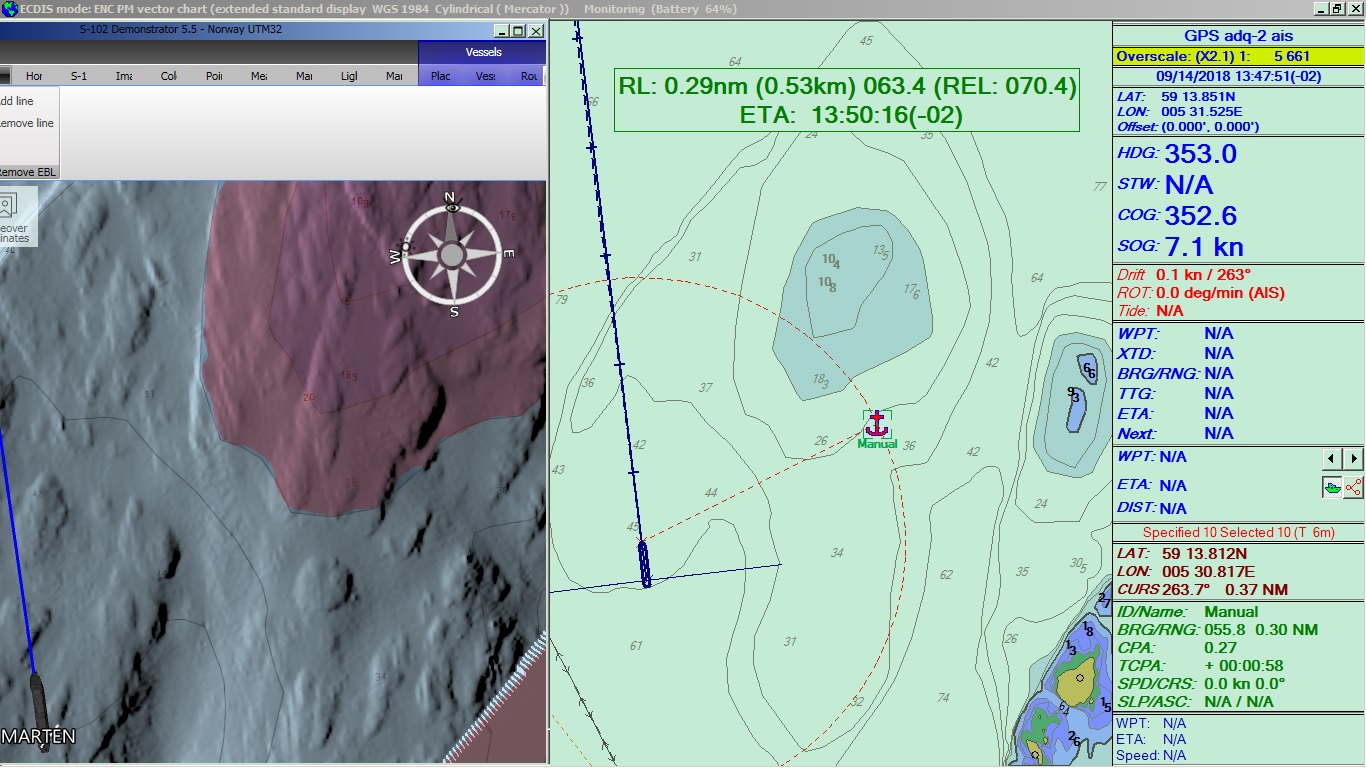
Spilt screen on marine pilot’s PC –
left : S-102 Demonstrator – right: ECDIS900 with EBL to anchor position
Results
Functionalities used & regarded as the most useful during the test:
- During the selection of the anchor position, the “light setting” function was utilised to get the bottom topography and bottom structures presented in a usable way.
- Of particular importance was to get lighting that easily distinguished between hard and soft bottom conditions.
- During the test, when the wind was blowing northwest, an anchor position was selected in a small valley quarry with soft bottom conditions on the north side of a rock formation.
- The “mouseover coordinates” function was used to extract depth and geographical coordinates (for transferring position to the ship’s ECDIS).
- During the actual manoeuvring operation to the anchor position, the program’s EBL function used the references from the ship’s bow.
- Having the ENC map as an overlay was considered a very useful option.
Experience from the test
The S-102 gives an impressive picture of the bottom topography where there is the ability to distinguish between hard and soft bottom sedimentation, this is very important information when planning secure anchor positions. On a traditional ENC, there are very limited opportunities to extract this type of information.
The captain of the LPG vessel “Kithnos” was very impressed with the possibilities of the S-102 standard, and the utilisation of such a map product with regards to both safe navigation and anchoring.
Additional requested functionalities
Numerical display of course and speed information on individual ships would be useful.
Evaluation – Value potential
During the testing it was identified how the use of S-102 data would add value and ease the planning of safe anchorage. By giving marine pilots access to S-102 data for their area of operations, they can plan better and determine the right position of anchorage based on the weather and current. Anchor dragging hazards and the potential consequences of ship grounding could be mitigated and hopefully avoided.
Below are two illustrations (a & b) of the same anchorage area in “Hervikfjord”. This area is used by large tankers entering the Kårstø gas terminal.
a) The ENC section shows the anchor positions currently used in this area.
An ordinary ENC overview in the “approach band” gives very little information about terrain formation and bottom condition which is important in connection with anchoring.
b) The S-102 map of the same area, gives a completely different and detailed picture of both topography and bottom condition.
You can observe that the best anchoring positions are not on the base peaks that we can clearly see consist of mountains, and is therefore inappropriate, but in deeper valleys where the bottom is covered with what we can interpret as soft-bottom sediments (see red arrows on map section).
This is confirmed in practice where anchor positions have been selected based on previous experience and the use of specially ordered maps (where bottom condition has been determined by backscatter data gathered from multitrack echo sounders).
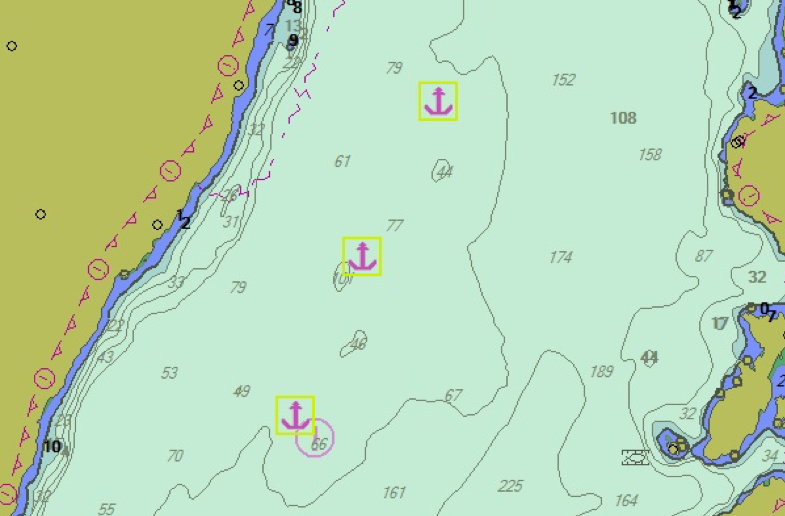
a) ENC 
b) S-102
