Summary of Project Results
At the inception stage of the project in 2017, our main objectives were to have a more in-depth understanding of the value chain, potential opportunities and the perceived challenges associated with bathymetric data, in relation to the new S-102 Standard.
As detailed in the original plan from IHO, version 2 of the S-102 Standard was scheduled for release in 2018, but this has now been postponed to late 2019. Despite delays in the release of version 2 of the S-102 standard, we have continued to conduct the majority of planned activities and testing.
The activities were focused on dynamic end-user involvement which succeeded in bringing in relevant stakeholders in Norway. This highlighted the value, opportunities and challenges stemming from data production and its usage in an operational environment.
The exceptional enthusiasm and engagement from all parties during the project has been the main key to its success.
Without doubt, general knowledge and levels of awareness relating to S-102 and bathymetric data has increased vastly throughout the duration of the project. The impact of the project hasn’t just stopped with those directly involved, it has gone on to stimulate interest in many other areas, and people, which has resulted in requests to share our knowledge through conferences, seminars and meetings.
Interest in S-102 is now considerably higher, than in the two years since the project began, and we are only too happy to take some of the credit for this!
Below, you will find short summaries of the results from our research and development activities. More detailed information can be found on the separate pages for each individual area of activity.
Operational tests
The main purpose of the project was to show how bathymetric data could provide value to professional maritime end-users and communities. Representatives of several communities were invited to participate as partners in the project and as part of our reference group.
The theory behind the operational testing was to allow the various parties to get concrete evidence of the values and limitations of using bathymetric data, by using a hands on approach in planning and performing the assignments.
The Coastal Administration participated in the testing via the use of a VTS station and several types of pilotage missions. The Royal Norwegian Navy wanted to test on both high-speed military vessels and in connection with underwater operations, e.g. submarines and mine operations.
During the tests, exceptional value was identified in the following areas:
- Planning of operations
- During the execution of operations
- Post operations – as an evaluation tool to assess efficiency, improvement potential, etc.
Planning:
All the operational tests proved that through the use of the S-102 data and the Demonstrator/3D visualisation tool, a much clearer picture of operations can be planned and performed.
During several of the tests, the onboard crew were involved in the actual planning process and their feedback was exceptionally positive. Several testers were surprised by the gap between the mental image they had formed using traditional sea charts / ENC, in comparison to the ability to visualise the seabed formations in 3D. Applying the data in the planning phase also allowed better strategic decision making and thus reducing the risk of undesirable incidents during the operational phase.
The Navy found this of particular interest and as a result one of the students at the Royal Norwegian Naval Academy decided to write their bachelor’s thesis based more on an in-depth analysis of the value S-102 has in planning Navy operations.
During assignment /execution of operations:
Throughout the assignment, the value of the S-102 data and 3D became clearer with the ability to add more layers of information.
With the use of S-102 data, in conjunction with ENCs and other navigational aids, it is possible to push the margins of loading whilst also finding new, more efficient sailing routes that would allow for savings on emissions.
In a navigational context, it proved very helpful to have the option to select and show several layers (e.g. topography, orthophoto, AIS) that can be used with bathymetric data to reconcile navigational choices, etc.

AIS positions from other vessels can give a transparent picture of the nearby surroundings. Having access to the exact model of your ship in the Demonstrator aids in adding even further value as it gives you the ability to adapt operations “real-time” based on actual draught, water level and safety margins.
Post operations/Debrief
In many contexts it can be useful to evaluate how assignments were carried out. During this process, the value of the operational testing using S-102 data and the Demonstrator / 3D Viewer became very apparent. The ability to analyse the choices and decisions made during the planning and operational phases, will make future improvements to corresponding assignments possible.
For more detailed information from the different operational tests – please look at this page: OPERATIONAL TESTS
Data Production
Throughout the project the importance of knowing how and what the S-102 datasets could be used for became the main priority. The usage intention impacts several factors relating to the production, and eventual distribution, of the dataset.
- Resolution
- The need for high level resolution (1×1 meter) demands that the survey is carried out with advanced modern multi-beam sounders.
- In addition, a dataset with high resolution will be approximately 100 times bigger than a dataset with the resolution of 10×10 for the same area.
- Algorithm
- For some user groups, “shoalast depth” is the priority, while for others “basic weighted mean” is of more importance.
- Uncertainty level
- Knowledge of the uncertainty levels the data represents is significant to the end-users.
- It is important that uncertainty information is easily understood.
- How levels of uncertainty will be presented are yet to be concluded, however the use of metadata , i.e. year of the survey, might be of relevance.
It is essential to have an overview of the available data with the required level of quality to produce high resolution S-102 datasets. Even with the use of modern equipment at the time the surveys were conducted, it does not always guarantee suitability to produce S-102 datasets.
Many nations, including Norway, have restrictions in place for data utilised for non-military purposes. In Norway, it is possible to request access based on a specific time period, i.e. shorter or longer. Currently, access to data is granted only by the Norwegian Armed Forces.
A new law was passed in 2017 but has yet to be implemented, once this comes into effect, there may be areas that will be downgraded. It is expected that this will increase the requests for S-102 data substantially and plans are being made by the Norwegian Hydrographic Services in preparation of an increase in demand.
For more detailed information, please click on the following link: DATA PRODUCTION
Data Management
Handling bathymetry data is nothing new, but managing data produced in accordance with the new IHO S-102 standard is. Compared to other navigation data, the S-102 dataset is relatively large in data volume. It is difficult to make an exact comparison, but we are looking at a data volume 10-20 times larger than the corresponding coverage in the ENC format. Sometimes even bigger.
Based on the S-102 standard, we have established several automated tests that take place when the data is uploaded to the database. As experience is gained, the number of automated tests will rise as the number of dataset uploads increase.
We have chosen Amazon Web Services as our preferred data storage for the S-102 data, our experience tells us that the costs associated with data storage are relatively modest compared to that of transporting the data.
For ease of access to S-102 data from the S-102 Demonstrator application, we developed an API whereby the client application downloads a GeoJSON file, with one feature for each S-102 data set that the user has access to.
Finally, the S-102 data will be made available via the PRIMAR Chart Catalog, where selection and ordering will be possible. The PRIMAR Chart Catalog is currently capable of handling orders for S-102 data, but so far these remain unencrypted.
For more detailed information, please click on the following link: DATA MANAGEMENT
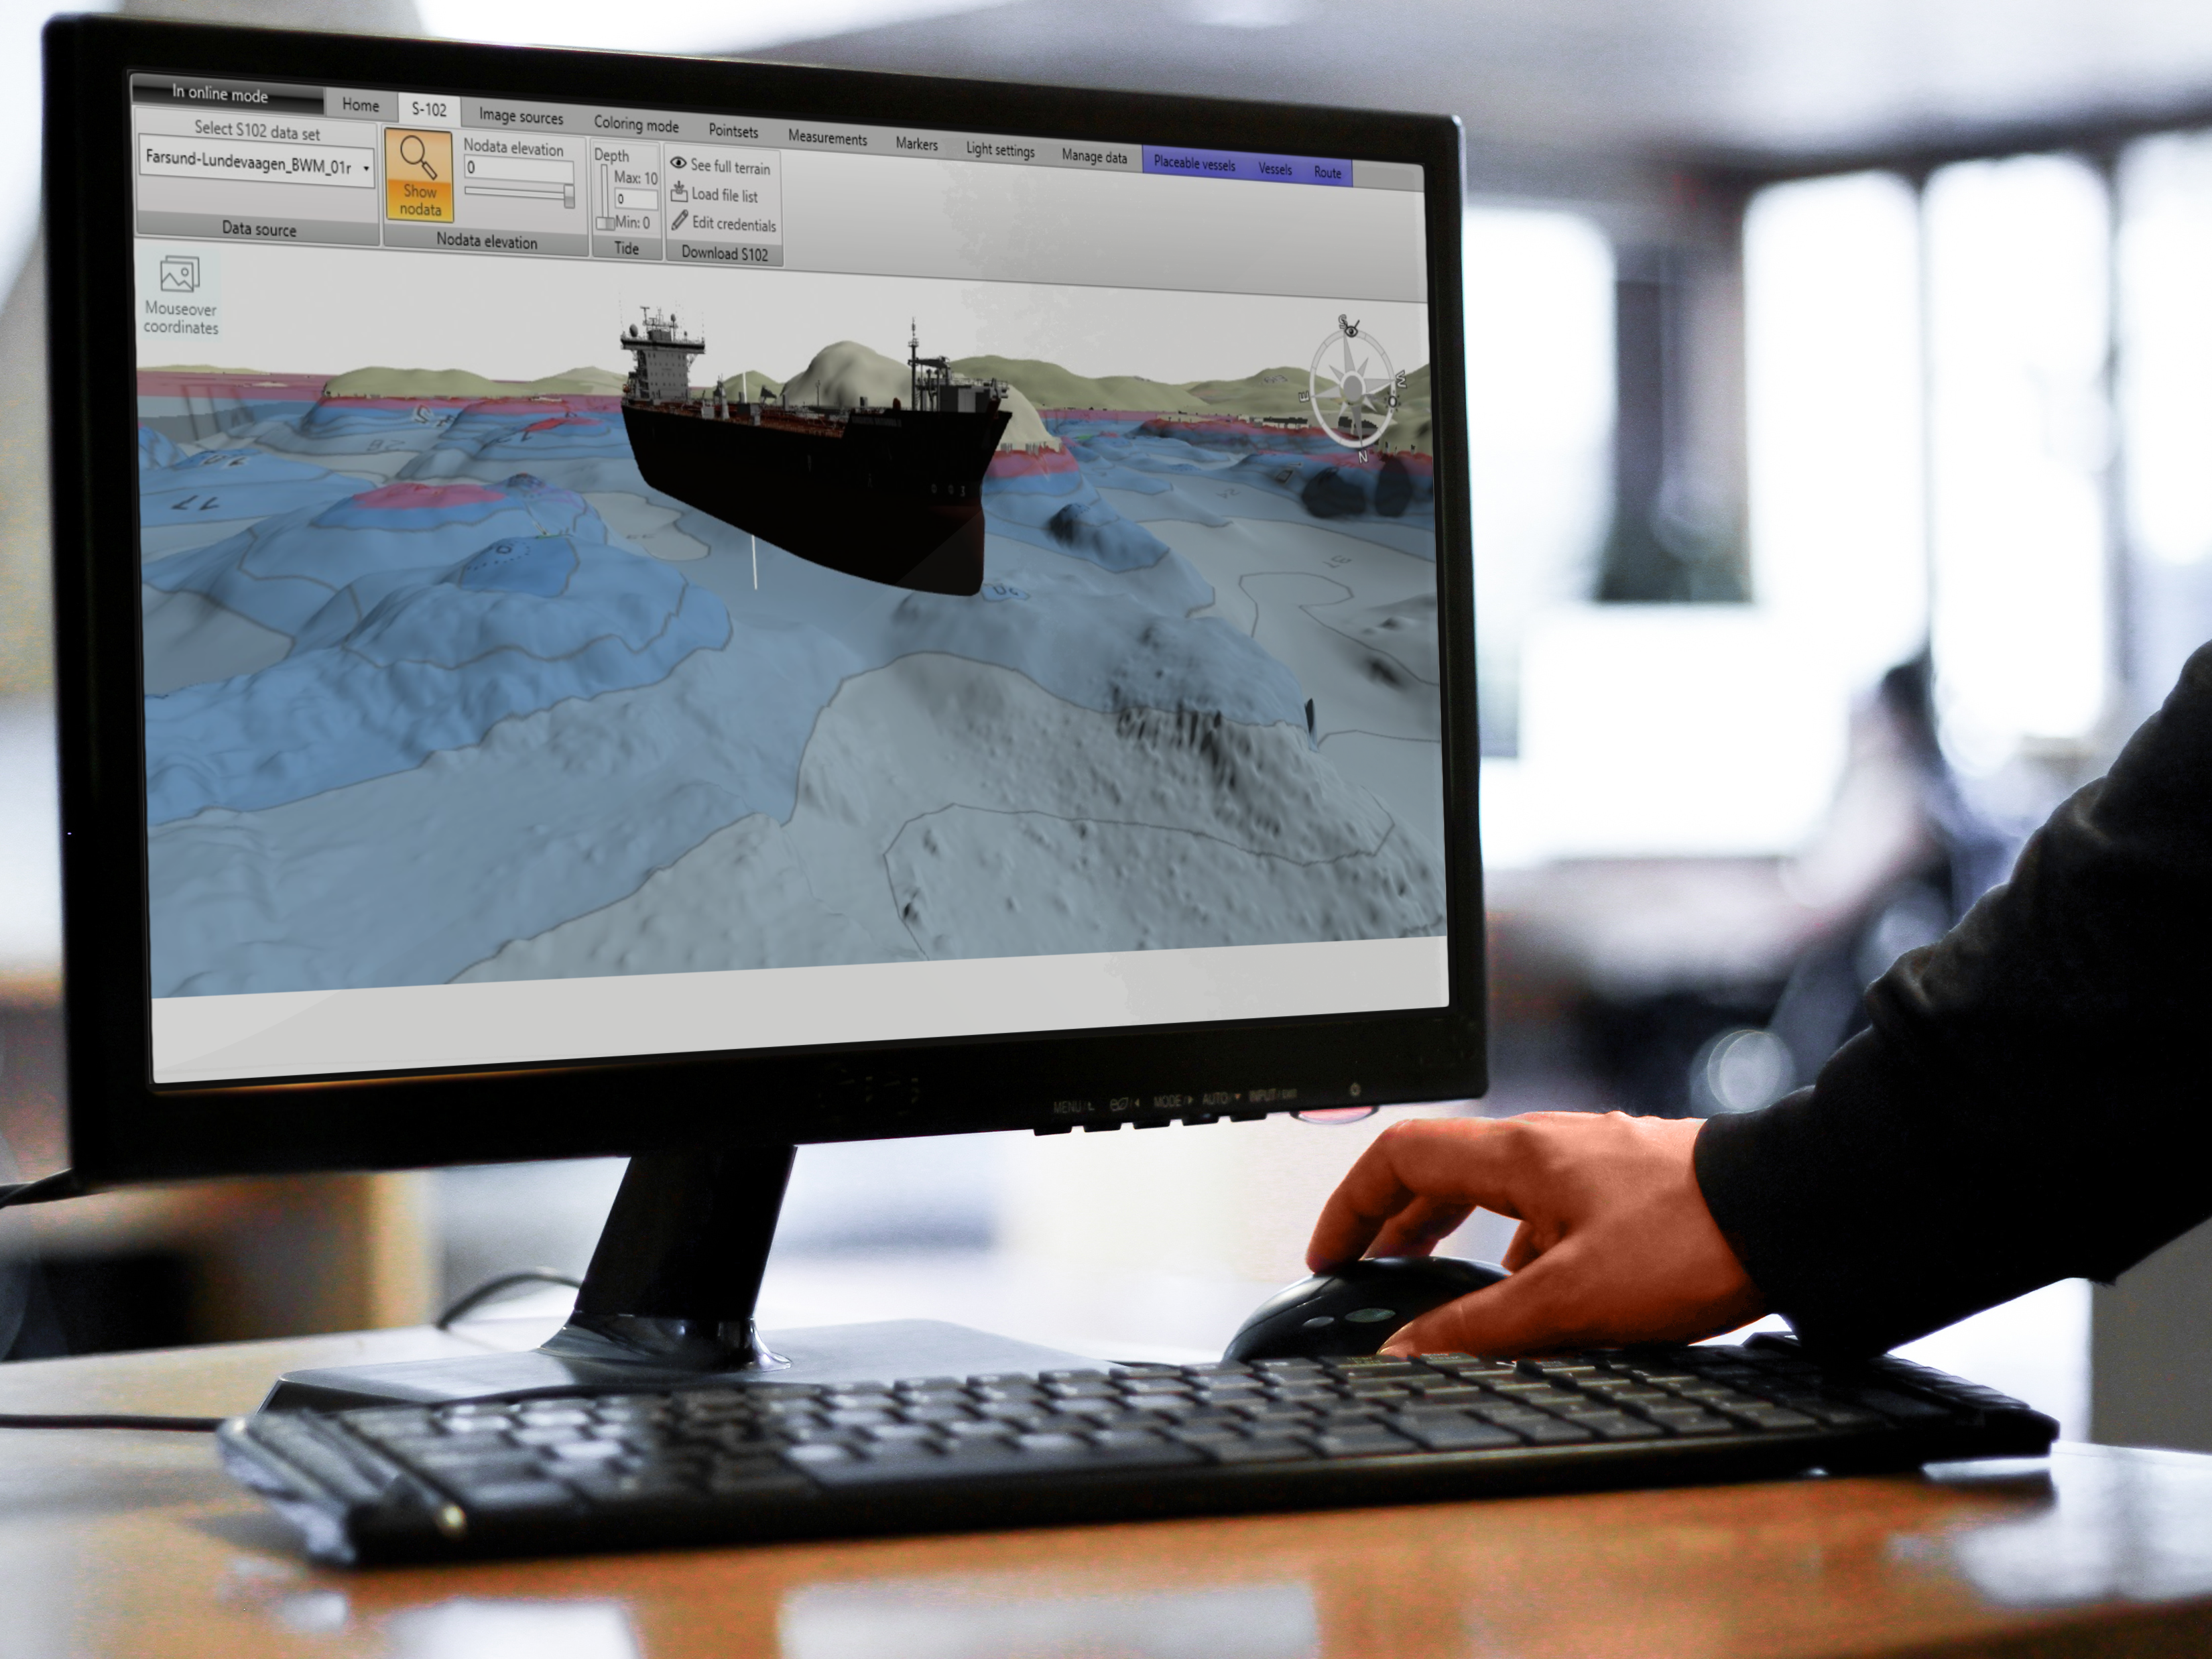
3D Visualisation tool / S-102 Demonstrator
The team decided early in the project, that the Demonstrator would be based on a Windows platform and not support other operating systems – the decision was taken to keep the development as efficient as possible. This also allowed focus to remain on developing functionality, supported by a powerful high-end windows laptop, in order to perform operational tests onboard vessels etc.

During the project, five official prototypes were released, each of them based on the requirements and input from the representatives in the Reference group. By using an agile project development methodology, we were able to verify expectations and gather enhancement requests from the Reference group in a smooth and efficient manner.
Involving potential end-users (in this case, via the Reference Group) in the development, not only fully engaged and committed the users, but also provided a much better end result and customisation of their actual requirements, than might have been achieved without their involvement.
During the project the S-102 Demonstrator turned out to be an extremely efficient tool in revealing the value of the S-102 data, both internally and externally for a much wider audience of potential consumers.
For more detailed information, please click on the following link: 3D VISUALISATION TOOL
S-102 STANDARD
An important part of the project was to test the S-102 product specification.
Based on our activities, we wanted to uncover any areas where there was a need for clarifications or changes to be included in the new ratified version of the S-102 product specification.
The project identified several new changes and improvements for consideration to the new S-102 Standard, many of which were recognised and have now been included in the draft version 2.0.0.
Direct changes to the standard as a result of input from the project:
- Coordinate reference systems
- New edition coverage
- Naming convention
- Dataset size
- Gridding methodology
- Purpose
- Data integrity and encryption
- Data quality
For more detailed information, please click on the following link: INPUT TO NEW S-102 STANDARD
