About*
The Royal Norwegian Navy produces naval forces and provides maritime capabilities for operational deployment in peacetime, crisis and war – both nationally and internationally.
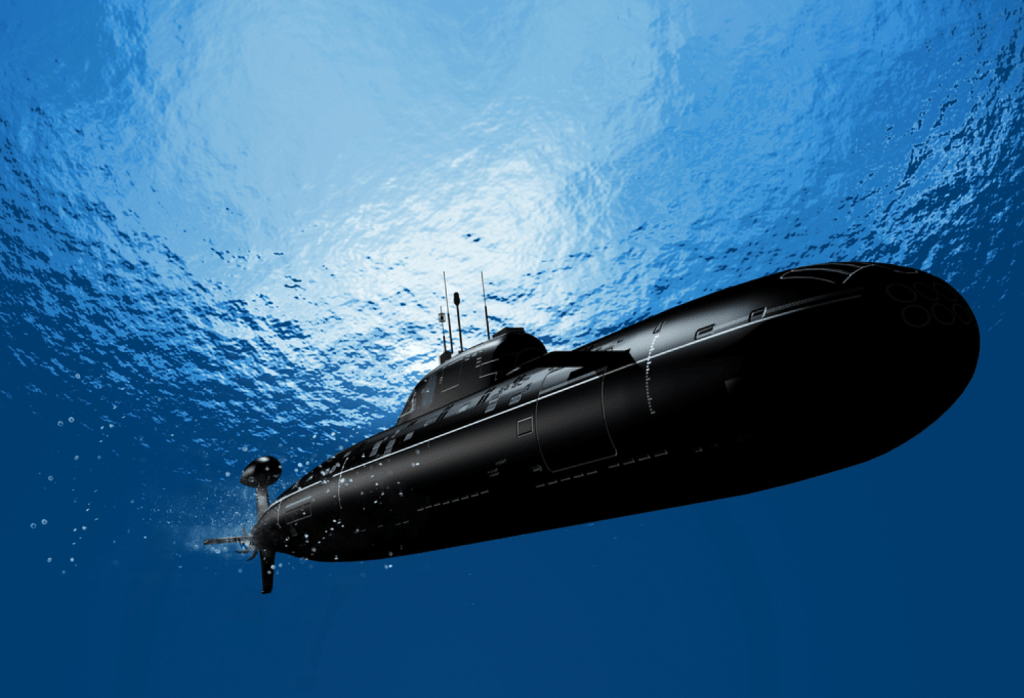
The Norwegian fleet is responsible for manning, training and maintenance of the Navy’s units and their associated operational support units. Main naval units include the frigates of the Fridtjof Nansen-class, the submarines of the Ula-class, the corvettes of the Skjold-class and finally, the MCMVs of the Oksøy-class and the Alta-class. All units are home-ported at Haakonsvern naval base in Bergen, Western Norway.
*this information & more could be found at The Royal Norwegian Navy’s website:https://forsvaret.no/en/organisation/navy
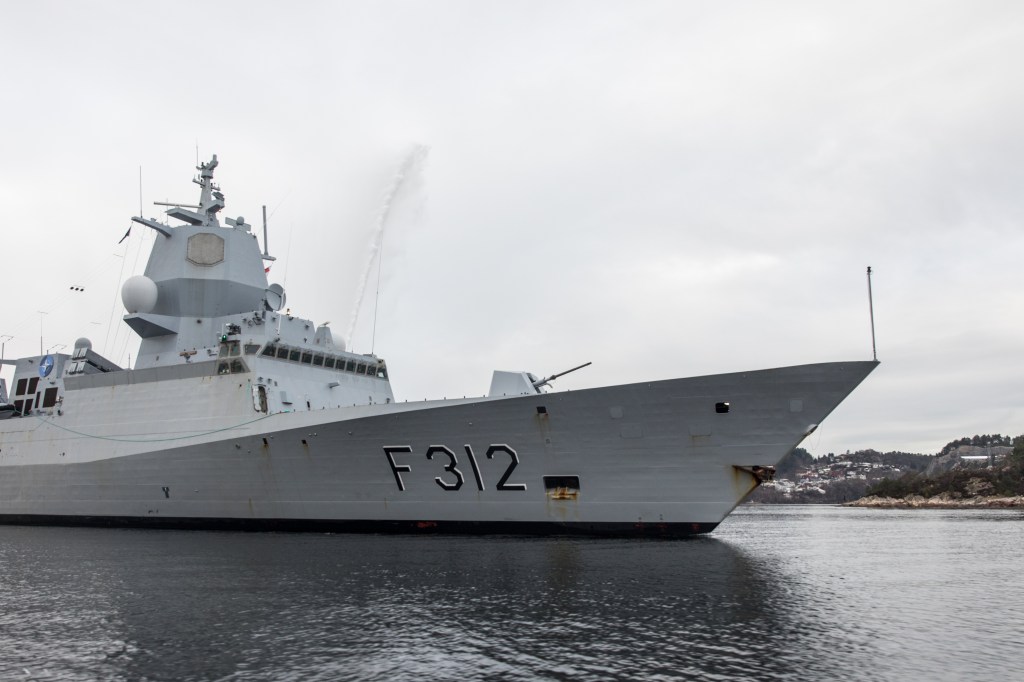
(Photo credit: Mats Nilsen/Forsvaret)
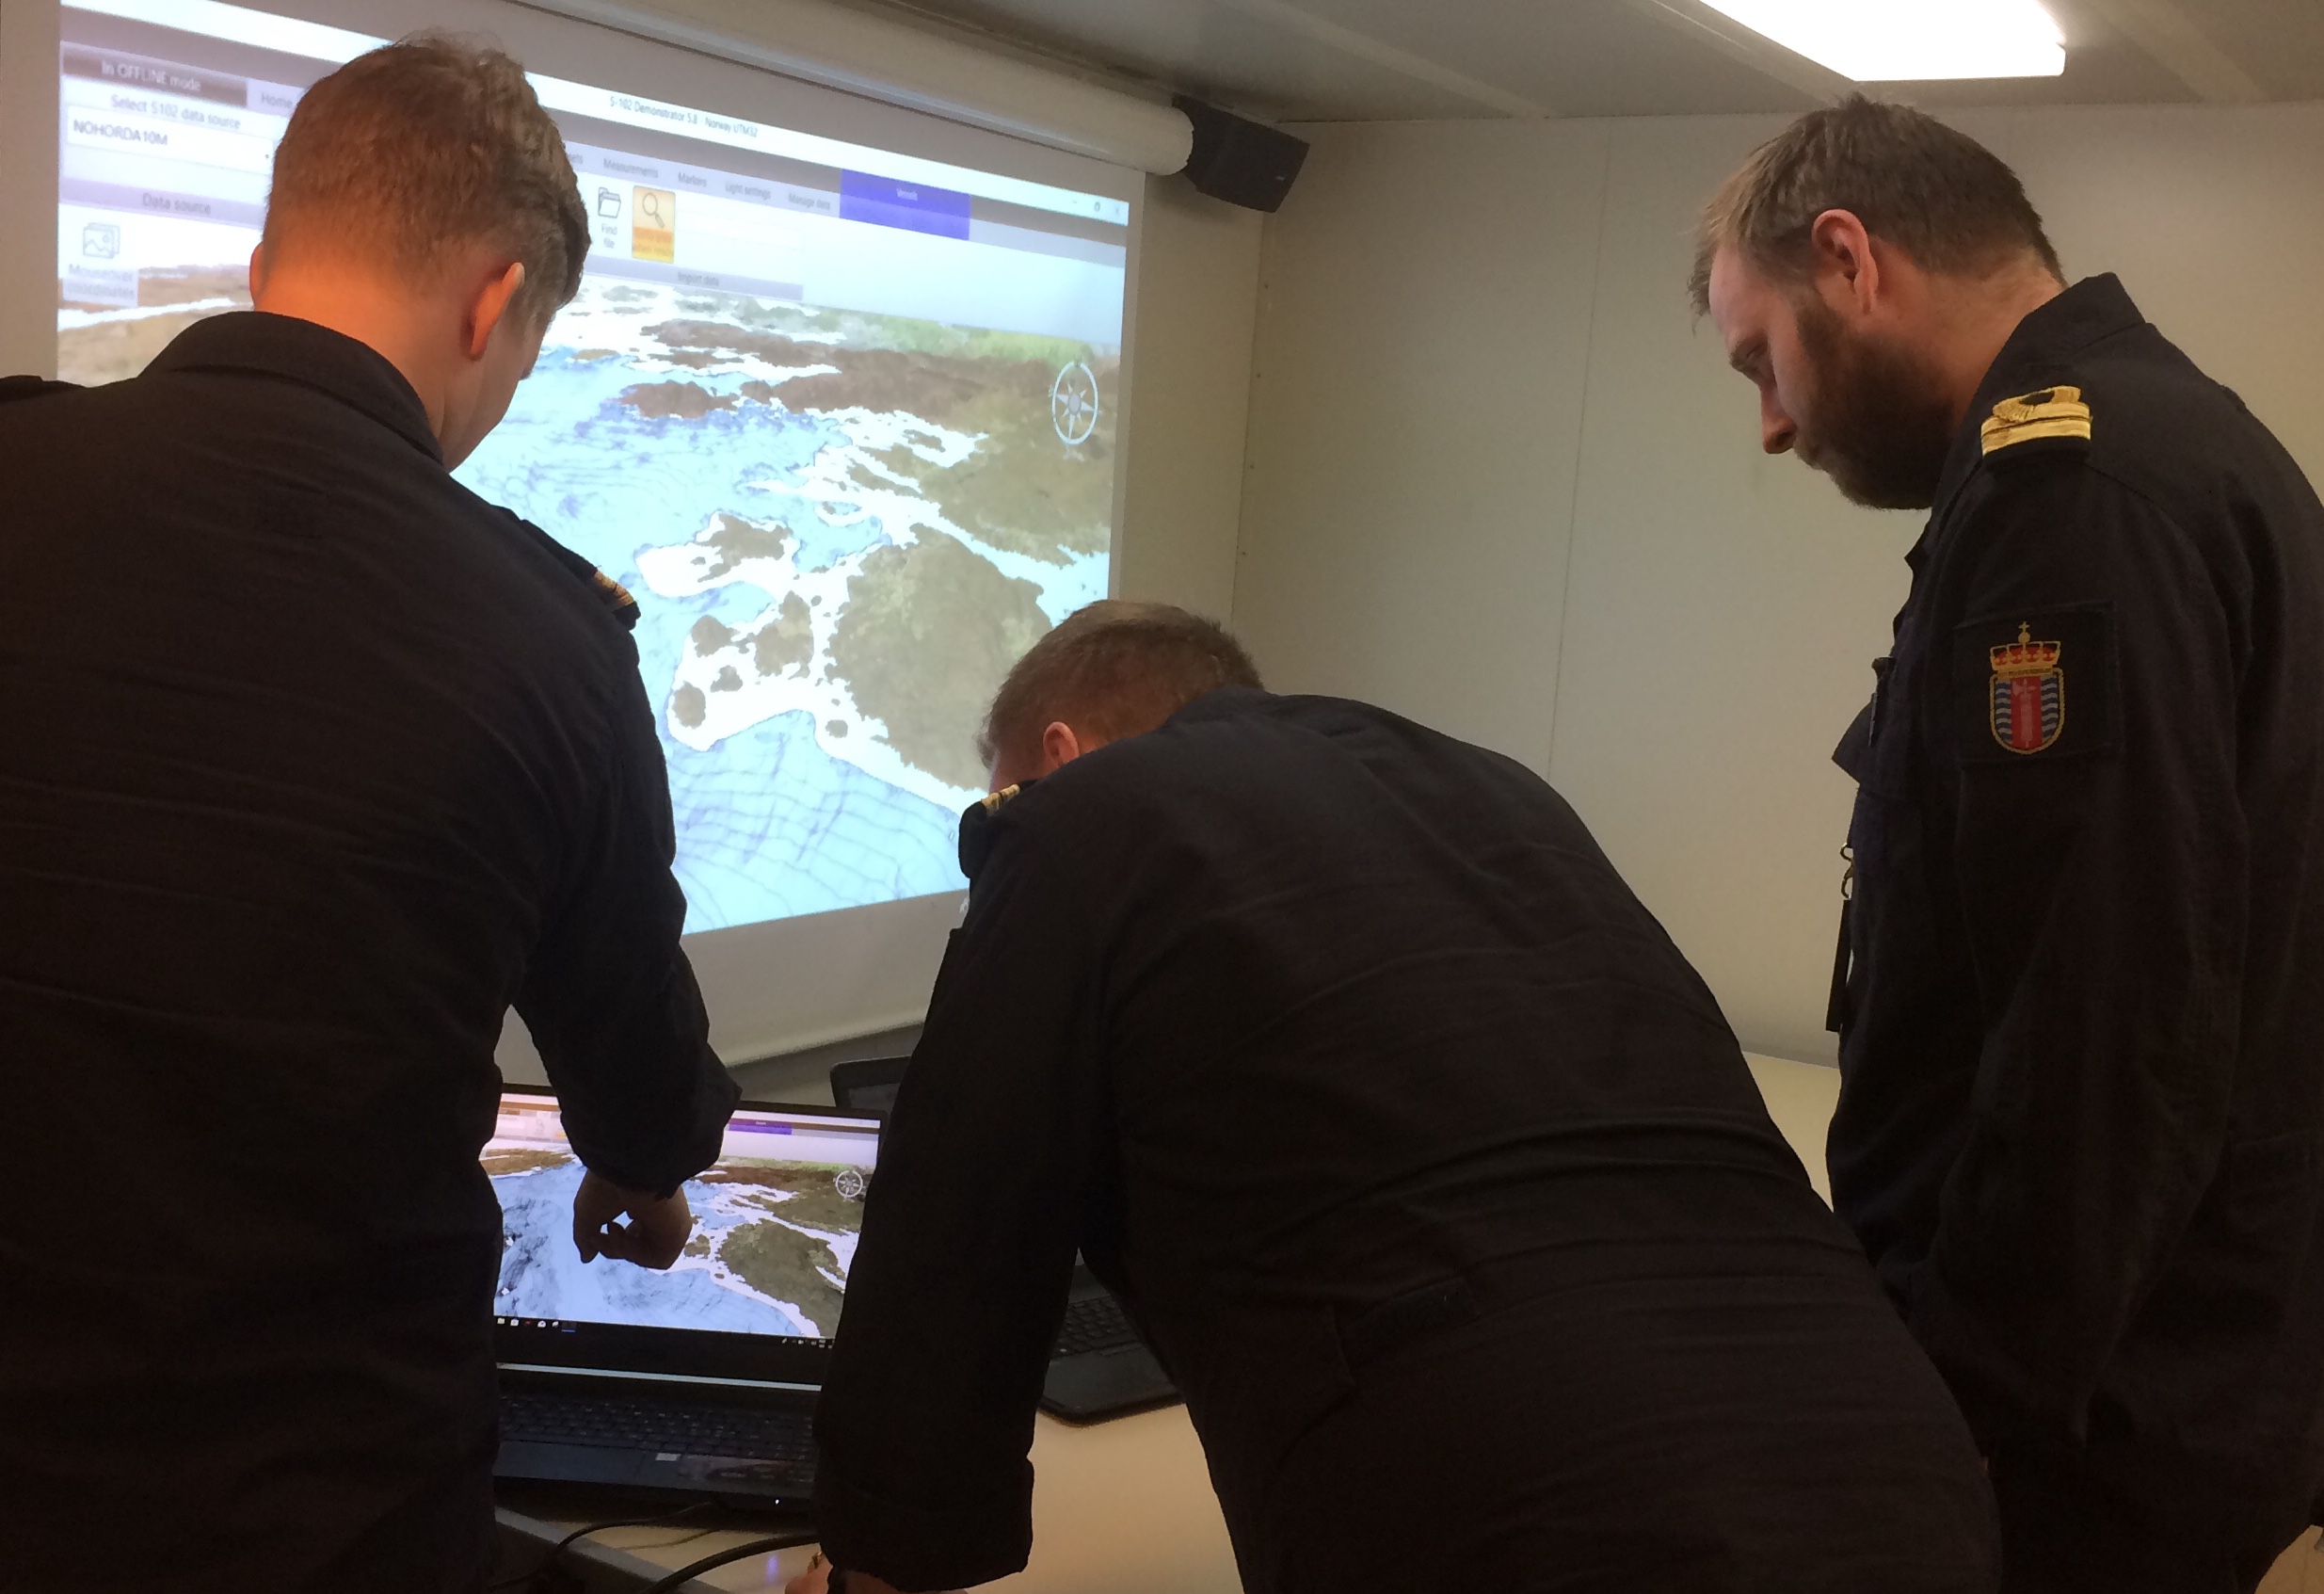
Test Mission
The purpose of the test was to review, together with representatives of anti submarine warfare and submarine warfare, what S-102 data and the S-102 Demonstrator can do for underwater war operations in comparison to the data and tools currently available (ENC and detailed contour line maps, AML CLB).
Test execution
- Date of test: February 2018
- Responsible tester: Inger Johanne Moen (Military Geographer)
- S-102 Demonstrator Version: v.5.8
- Weather Conditions: n/a
Dataset used
Bjørnafjorden in Hordaland was predominantly used. In order to assess different resolutions on the models, 25m was also used in Farsund and 1m in Rogaland.
Layers/Charts
Orthophoto, S57 and background map.
Chart system
ENC’s were used to some degree for comparison.
Investigating what S-102 data can show compared to other sources i.e. ENC and AML
Results
Functionalities used & regarded as the most useful during the test:
- The different palettes and measuring tools proved particularly useful for the operation. Other functionalities were also demonstrated – AIS with the correct model view, follow, height multiplier and pan functions in the map view.
- The ability to see the vessel from all angles is the most important feature for the type of voyage undertaken.
Experience from the test
- The aim of this mission was initially to establish whether using S-102 data and the S-102 Demonstrator gives a much better understanding of the terrain, as opposed to using ENC’s. By using the S-102 Data and Demonstrator the operator gets an overview of where a submarine can operate in concealment of the terrain in relation to where the frigate is working. Good resolution of the data model gives one an impression were there are areas with soft sediments – on resolutions down to 1m, the operator is able to see where stones lie. Based on this type of information, there is the ability to plan for the possibility of appropriate sites to hide/lay prior to an operation.
- Navigation – During the test, discussions also took place regarding the benefits of using the S102-Demonstrator in the planning and monitoring of voyages. The demonstrator provides a 3D impression of what could potentially be encountered when entering the waters in question. By showing orthophotos alongside bathymetry and navigational aids, you are able to get a completely different understanding of the terrain you plan to sail through.
Additional requested functionalities
- Although this is not meant to be a tactical system, the opportunity to make deeper intervals on the seabed (than is currently available) would be useful.
- There are areas a submarine could, theoretically, lie down on the bottom. If it was possible to mark an area deeper than a given depth, it would be easier to see areas unsuitable to lay a submarine.
- The functionality to have sediments as layers that could be toggled on and off and used alongside “colouring modes” would be of value.
- Navigation – if it was possible to show FKB data (Official Norwegian Common Map database) such as buildings, pylons and churches on land in 3D, it would produce an even greater effect. ENC’s show little detail about such information on land. The navy navigate in a way very similar to the pilots, utilising churches, mountain peaks and masts to help navigate in the voyage.
- When planning a voyage and creating a route, it would be good to have the possibility to “play back” the planned voyage in the demonstrator and set the view on the bridge.
Evaluation – Value potential
Mine hunting
- The function of marking depth areas will be useful when looking for threats of different types of mines.
- In transit to an operating area, it might be useful to see where you can go at full speed.
- When planning a mine hunting operation in a particular area, an assessment is made of the expected bottom type and bathymetry within the box to be cleared. Based on that assessment, a plan is then made for the operation. During the operation, the plan could be corrected/amended by obtaining information directly from the seabed either via means of an underwater remotely operated vehicles (ROVs) or divers. If the information does not match the assumptions, the plan will have ot be rescheduled – this often leads to additional work and in some cases a reassessment to parts of the area.
- Access to high-resolution S102 data will facilitate in the planning phase, allowing for the possibility to estimate the nature of the bottom in a completely different way than using ENC data. Even with detailed contour lines, the probability of not having to re-plan will be greater when using the S-102 Demonstrator with high resolution of the data model.
Submarine warefare
Planning phase:
Using the S-102 data and demonstrator works well in the planning phase for site analysis. Used alongside existing and desired tools, it will immediately give:
- Overview of possible arrival routes for hostile submarine.
- Safe / unsafe depth is set to the estimated depth assumed to be the submarine’s “safety” limit.
- Overview of where the sonar will have “free view” to enemy submarine.
- Dynamic free-sighting tools would be desirable
- Overview of areas which you can expect submarines will “hide”.
- This is done by colouring a given depth area.
- Areas with soft sediments can be estimated by evaluating high-resolution S102 data.
- A separate layer of sediments describing the nature of the bottom, however, would be desirable
- Good resolution of the model will give information on where there are stones on the bottom and thus unwanted for bunning
- For mine clearance, good resolution of the S102 data will aid in the planning of operations, omitting the necessity of continual adjustment to the plan as direct observations of bottom conditions are obtained.
Onboard in operation phase
- Sonar contacts can be compared to the S-102 data to see if there is anything on the bottom that may have given it an echo (a measuring tool will be useful).
Post operation phase:
- The demonstrator can be used to visualise the completed operation and is used for analysis and feedback.
- Playback of RTZ track and adding waypoint would be useful.
