
A recurring theme in the reference group meetings, has been the discussion relating to the quality aspect of the data. The reference group expressed a clear need to be able to see and understand the quality of data made available in their end-user tools.
End-users can then focus attention on the quality and add the necessary safety margins, where required, when using the data. A common perspective of the reference group is that if such information is available, there should be the possibility to view it. If information is found in the metadata, the systems should be able to retrieve, view and display this information easily.
Quality can be encoded and displayed in different ways and during the project period, even more metadata has been added to the standard. This information can hopefully be used to help end-users better understand the standard of quality required. Specifically, in relation to a clearer description and registration of the algorithms used to create an S-102 dataset (based on the multi-beam echosounder data). Also, metadata can now be encoded to inform the end user of the purpose of the data, i.e. navigational or other purposes. It was also suggested that more information about the survey used to create a dataset, e.g. survey year, measuring equipment used and calibration of equipment, should be provided to allow a better understanding of the quality of the data.
Challenges Identified
- Since an S-102 product can consist of a set of different surveys, from different time periods, using different measuring equipment, a solution needs to be identified on how the various components can be coded and possibly displayed. These are part of the challenges IHO will investigate upon further development of the standard.
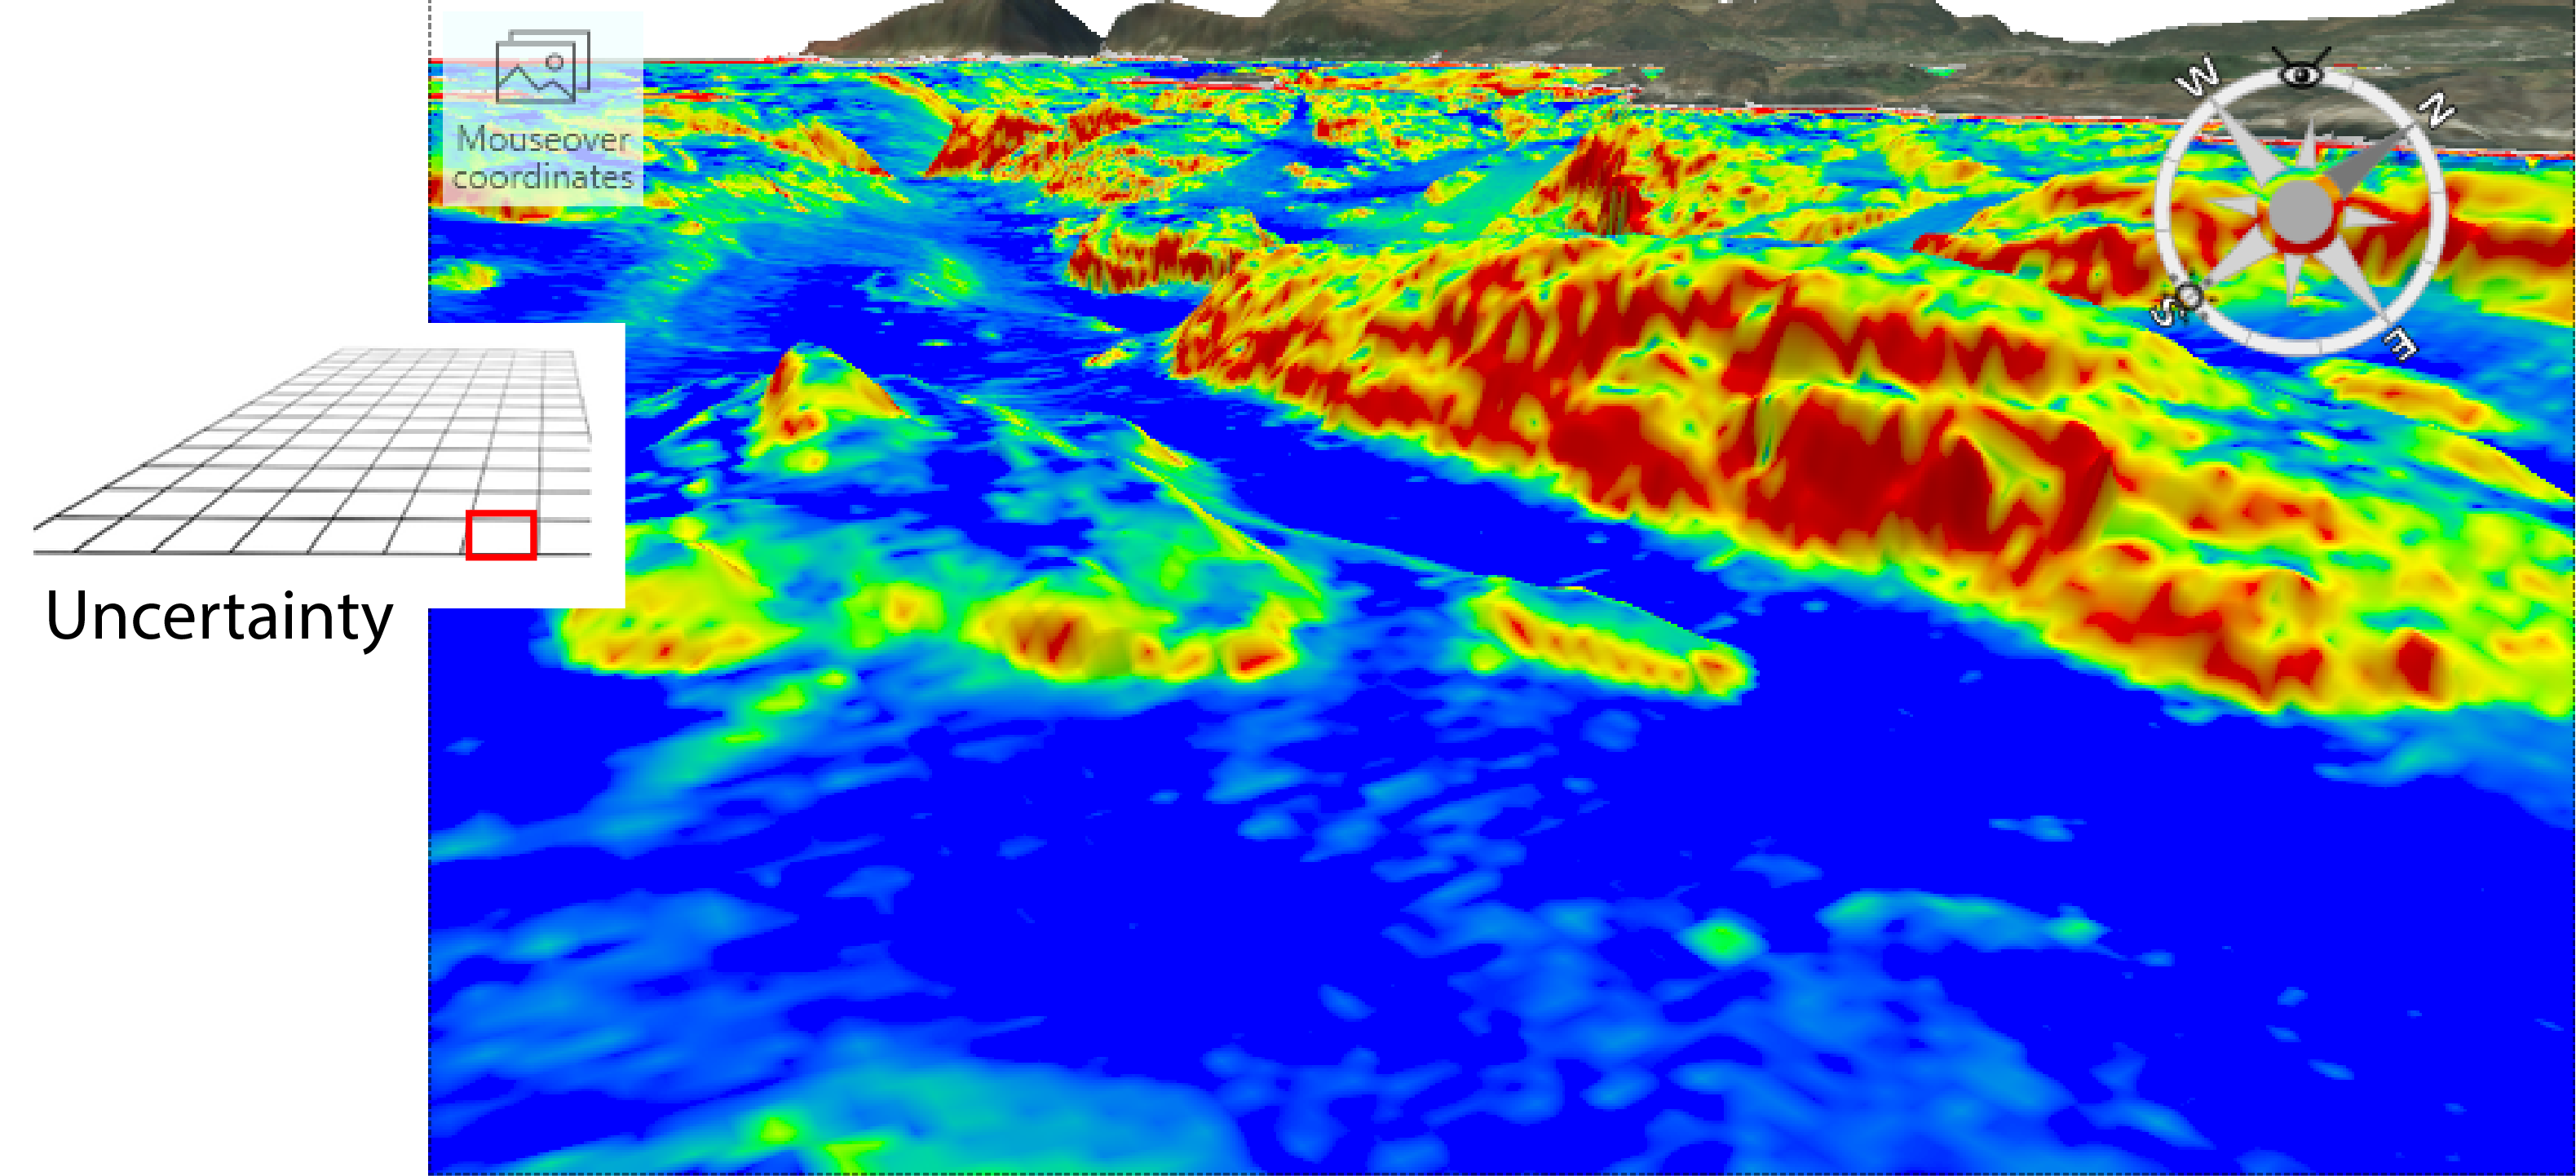
- In the test data, uncertainty is encoded, so that for each grid node with a depth value, an associated uncertainty value can be found. In the S-102 Demonstrator, an interface has been developed that can visualise this layer of uncertainty. The question remaining, is to what extent an end-user can extract some value from this, without having a greater understanding of what the uncertainty means.

Quality and satisfactory ways of displaying quality is not merely an S-102 challenge, work has been ongoing in IHO for a decade on developing good solutions for displaying data quality related to ENCs. Several proposals for solutions have been outlined through the IHO Data Quality working group, some of which may also be of interest for S-102. For further information regarding this, please refer to the Data Quality working group on the IHO website.
As of today, we have 13 defined automated upload checks in our VPN test system. The checks were defined after review of the product specifications and are mainly aimed at naming convention, coordinate system and coverage / bounding box inconsistencies.
A separate annex for validation checks was discussed in the standardisation work with S-102, but this annex will not be included in S-102 2.0.0. In parallel to the development of a general S-100 validation, we hope that an annex related to validation checks will also be implemented in the next version of the standard (3.0.0).
In anticipation of standardised validation checks, ECC have also defined several additional upload checks specifically related to grid, feature and attributes, metadata, overlap and exchange directory. These were not implemented in our test database during this current project period, but we plan to implement them during the next R&D project, “S-100 Demonstrator”.
Lessons Learned
Automated and standardised validation checks will be needed to ensure data quality and effectiveness in the uploading process of S-102 data.
Ways of identifying and visualising data quality, in a manner that is easy for end-users to understand and base their decisions on, are of high importance. One idea would be to visualise specific metadata (e.g. when the data survey was created) in the end-users solution, however, this needs to be visualised in a manner that adds value and not just create further confusion.
